Everything you ever wanted to know about Google’s Core Web Vitals Metrics
Content, keywords, and backlinks are important search ranking factors. However, compare two sites with similar content and target markets: the one with the best web experience should rank higher. Better performance leads to a higher position in Google search.
Which raises the question: how does Google assess performance?
Tools including WebPageTest.org and browser DevTools can take technical measurements such as:
- Blocking time — the time spent waiting to download because other assets have a higher priority
- DNS resolution — the time taken to resolve a host name to an IP address
- Connect time — the time required to create a TCP connection
- Time to First Byte (TTFB) — the time taken to receive the first byte
- Receive time — the time required to read the entire response
- DOM load time — the time to download the HTML content
- Page load time — the time taken to download all page assets
- Page weight — the total size of all compressed/uncompressed assets
- DOM elements — the total number of elements in the page
- First Contentful Paint (FCP) — the time taken before the browser renders the first content
- Speed Index — how quickly content renders during a page load
- First Meaningful Paint (FMP) — when the primary page content becomes visible to the user
- Time to Interactive (TTI) — how long it takes before a page is fully interactive and can respond to user input
- First CPU Idle — how long it takes for a page to become interactive
- CPU utilization — the processing activity required.
Although useful, these metrics are somewhat abstract. They do not determine whether a page offers a good or bad user experience. For example, a page may never “complete” loading because it provides real-time functionality which continually downloads small assets. Assessment tools timeout despite the page feeling fast and responsive.
Core Web Vitals
Google’s Core Web Vitals are three performance metrics which aim to assess real-world user experience. Does a site feel fast?…
- Largest Contentful Paint (LCP) — loading metric
- First Input Delay (FID) — interactivity metric
- Cumulative Layout Shift (CLS) — visual stability metric
Scores are based on the previous 28-days of real user metrics anonymously collected from the Chrome browser. Network and device performance varies so average scores are not always representative. Google uses the 75th percentile, i.e. sort scores from best to worst, then take the figure at the three-quarters point. Three out of four site visitors will experience that level of performance or better.
The signals will be adopted for page ranking from mid-June 2021. They will influence where your pages appear in mobile search results and desktop algorithms are certain to follow.
A good ( “green”) Core Web Vital score makes your site eligible for inclusion in the mobile edition of Google News and the “Top Stories” search carousel. These have been restricted to Accelerated Mobile Pages (AMP) even when your standard site had better performance. This change could provide a noticeable traffic boost, especially if your competitors cannot adapt their sites before you.
The following sections describe the Core Web Vitals metrics. Understanding them will help you make the performance improvements which offer the most impact.
Core Web Vitals tools
The following tools calculate scores on your local device. They can analyse development sites running on localhost or network servers:
Local tools attempt to emulate slower networks and processing speeds. Online tools can evaluate the performance of live sites:
Finally, you can measure real user performance on your live site:
Largest Contentful Paint (LCP)
Largest Contentful Paint measures loading performance. How quickly is content drawn to the page?
LCP reports the render time of the largest image or block of text visible within the browser viewport; typically a banner, hero image, or heading. LCP selects one of the following elements:
Run a DevTools Lighthouse report and the Performance section shows the LCP score. The Largest contentful paint element section can be expanded to reveal the chosen element.
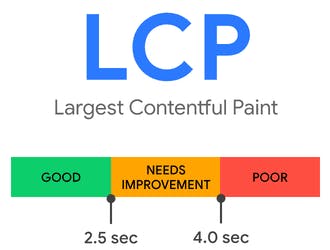
Pages which have an LCP time of 2.5 seconds or less are “good”. Times exceeding 4.0 seconds are “poor”:
Common causes of a poor LCP score include:
- network conditions, such as a slow server response and loading times, and
- render-blocking assets such as CSS or JavaScript which halt the page load.
Improvements are possible by:
- upgrading your server
- activating server compression and HTTP/2
- adopting caching, Jamstack, or similar techniques to reduce expensive server-side calculations
- using a Content Delivery Network (CDN) to host assets on servers geographically closer to users
- preloading critical assets so they’re ready sooner
- minimizing third-party requests and moving assets to your primary domain
- minimizing the number and size of requested files, especially at the top of the HTML file
- avoiding CSS
@importstatements - using asynchronous or deferred JavaScript, or serving ES6 modules rather than transpiled ES5 code, and
- ensuring the browser can cache files, perhaps using a service worker.
First Input Delay (FID)
First Input Delay measures interface responsiveness. How quickly does the page respond to user actions such as clicking, tapping, scrolling, etc?
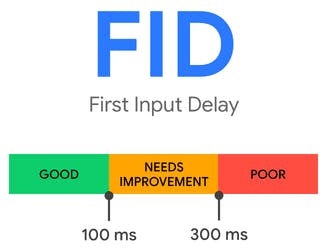
FID tools record the time between a user interaction and the browser processing that event. Pages which have an FID time of 100 milliseconds or less are “good”. Times exceeding 300 milliseconds are “poor”:
First Input Delay cannot be simulated because:
- it’s dependent on processor speed and device capabilities
- it’s only measurable when a page is served to a real user, and
- it measures the delay before event processing. It does not record the time taken to run a handler function or update the DOM.
Most assessment tools cannot calculate or show an FID metric. However, they do report a Total Blocking Time (TBT). This a reasonable alternative to FID which measures the time between:
- the First Contentful Paint (FCP): the time at which page content starts to render, and
- the Time to Interactive (TTI): the time at which the page is capable of responding to user input. TTI is presumed when no long-running tasks are active and fewer than three HTTP requests are yet to complete.
Common causes of poor FID and/or TBT scores include:
Improvements are possible by:
- generating static HTML content server-side where possible
- adopting progressive enhancement techniques so the user interface is usable before JavaScript runs
- minimizing the number and size of requested files
- removing unused CSS and JavaScript
- avoiding excessive use of expensive CSS properties such as
box-shadowandfilter - loading JavaScript asynchronously, deferred, or with ES6 modules
- breaking-up long-running JavaScript tasks
- loading third-party JavaScript on demand, e.g. chat widgets, social media integration, etc.
- delaying the load of less critical scripts such as analytics and advertisements, and
- using web workers to run tasks in a background thread.
Frontend Monitoring
Debugging a web application in production may be challenging and time-consuming. Asayer is a frontend monitoring tool that replays everything your users do and shows how your app behaves for every issue. It’s like having your browser’s inspector open while looking over your user’s shoulder. Asayer lets you reproduce issues, aggregate JS errors, and monitor your app’s performance. Asayer offers plugins for capturing the state of your Redux or VueX store and for inspecting Fetch requests and GraphQL queries.
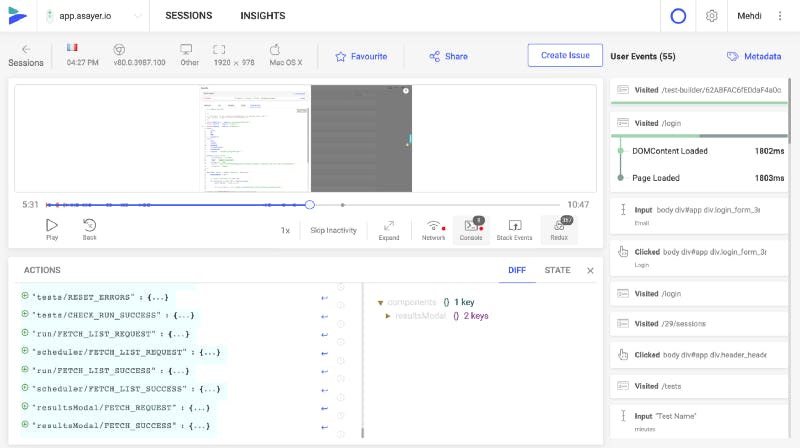
Happy debugging, for modern frontend teams — Start monitoring your web app for free.
Cumulative Layout Shift (CLS)
CLS measures visual stability. Does content move unexpectedly on the page?
The metric calculates a score when elements move without warning or interaction. This often occurs when you’re reading an article on a mobile device and the content jumps off-screen. It can be caused when an image or advertisement loads above the current scroll position. In extreme cases, it can make you click the wrong link or control.
The Cumulative Layout Shift score is calculated by multiplying an impact fraction by a distance fraction where:
- The impact fraction is the total area of unstable elements in the viewport which will move. If elements covering 75% of the viewport move during page load, the impact fraction is 0.75.
- The distance fraction the greatest distance moved by any single element in the viewport. Presume the greatest displacement occurs when an element moves from 0,100 to 0,600. This results in a vertical shift of 500px. If the viewport is 1,000px high, the distance fraction is 500px / 1000px = 0.5.
The Cumulative Layout Shift score is 0.75 x 0.5 = 0.375.
Note:
- Elements which cause a shift, such as an image, are considered stable if they do not move after they are rendered on the page.
- Layout shifts are not recorded during the 500ms period after a user interaction. This could trigger UI changes, such as opening a menu from a hamburger icon.
- Google has evolved the CLS metric so pages which remain open for longer are not adversely penalized. This includes single-page applications and infinitely-scrolling pages which shift content over time.
As well as the tools above, CLS can be examined with:
- the Cumulative Layout Shift Debugger (CLS), or
- the Layout Shift Regions option in the DevTools Rendering panel (DevTools menu > More tools > Rendering). Layout shifts are highlighted in blue so it can be useful set a slower network speed in the Network panel.
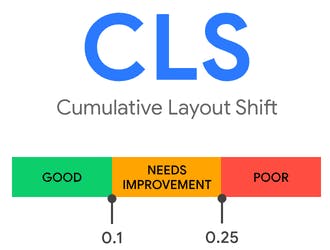
Pages which have an CLS score of 0.1 or less are “good”. Scores exceeding 0.25 are “poor”:
Common causes of poor CLS scores include:
- not defining dimensions for images, videos, and iframes
- web fonts which cause a Flash of Invisible Text (FOIT) or Flash of Unstyled Text (FOUT)
- content dynamically injected into the DOM — especially after a network request. This includes advertisements, cookie notices, newsletter sign-ups, etc.
Improvements may be possible by:
- reserving an area for images, videos, and iframe elements by adding HTML
widthandheightattributes - Using the CSS
[aspect-ratio](https://developer.mozilla.org/Web/CSS/aspect-ratio)property to reserve space - reverting to commonly available OS fonts
- setting CSS
[font-display](https://developer.mozilla.org/docs/Web/CSS/@font-face/font-display)tooptionalwhen loading web fonts. Alternatively, useswapand ensure a similarly-sized fallback font prevents a layout shift. - not inserting elements toward the top of the page unless it’s in response to a user interaction
- pre-sizing container elements for slower-loading third-party content such as advertisements
- using CSS
transformandopacityfor more efficient animations which do not trigger a re-layout.
Other ranking factors
Google’s June 2021 update will also assess the following metrics as well as Core Web Vitals:
- HTTPS Does the site establish a secure connection between the browser and server?
- Mobile-friendliness Is the site usable on small screen devices?
- No intrusive interstitials Is content always readable and not visually obscured by pop-up interstitials or banners which use an unreasonable amount of screen space?
- Safe browsing Is the site free from phishing pages, malware, and other harmful downloads?
Will the web get better?
Google has considerable power over the direction of the web. The company has not always acted with best intentions, but Core Web Vitals have a noble aim. We now have tools which measure page performance metrics based on real experiences. They will help developers concentrate on improvements which benefit their users most.
Originally published at blog.asayer.io on April 28, 2021.

