


Learn how to use this API to measure the performance of your apps
Browser DevTools are great for monitoring web application performance on your local development PC. However, they’re less practical for measuring site speed on different devices, browsers, and network connections across global locations.
The Performance API records DevTool-like metrics from real users as they navigate your application. You can post collected data to a service such as Asayer.io, e.g.
asayer.event('load-performance', {
'os' : 'Ubuntu',
'agent' : 'Firefox 88.0',
'location': 'US',
'pageload': 1522.598,
'paint' : 5969.123,
'ajaxinit': 1507.067
});
To help identify performance bottlenecks on specific browsers, devices, or even user sessions.
What is the Performance API?
The Performance API is a collection of APIs used to measure:
Historically, developers had to adopt the Date() function to record elapsed times, e.g.
const startTime = new Date();
doSomething();
const elapsedTime = new Date() - startTime;
console.log(`doSomething() took ${ elapsedTime }ms`);
but the Performance API is:
- higher resolution. Unlike
Date(), it records timings in fractions of a millisecond. - more reliable.
Date()uses the system time so timings can become inaccurate when the OS synchronises the clock.
The API is available in client-side JavaScript in most modern browsers and is detectable with:
if ('performance' in window) {
// use Performance APIs
}
Resource and user timing is also available in client-side Web Workers. These provide a way to run long-running or computationally-expensive scripts in the background which do not interfere with the browser’s main processing thread.
User timing APIs are also available in server-side:
- Node.js applications with the
performance_hookmodule, and - Deno applications run with the
--allow-hrtimeoption.
The Performance API and documentation can be a little difficult to understand partly because it has evolved. I hope the information and examples in this article help illustrate its potential.
Load timing properties
The sections below describe:
- page navigation timings which return a
[PerformanceNavigationTiming](https://developer.mozilla.org/docs/Web/API/PerformanceNavigationTiming)object, and - resource timings which returns a
[PerformanceResourceTiming](https://developer.mozilla.org/docs/Web/API/PerformanceResourceTiming)object
Both objects provide the following identification properties:
- name — resource URL
- entryType — performance type (
"navigation"for a page,"resource"for a page asset) - initiatorType — resource which initiated the performance entry (
"navigation"for a page) - serverTiming — an array of PerformanceServerTiming objects with
name,description, anddurationmetrics written by the server to the HTTP[Server-Timing](https://developer.mozilla.org/docs/Web/HTTP/Headers/Server-Timing)header
Both objects provide the following timing properties shown here in the chronological order you would expect them to occur. Timestamps are in milliseconds relative to the start of the page load:
- startTime — timestamp when the fetch started (
0for a page since it's the first asset loaded) - nextHopProtocol — network protocol used
- workerStart — timestamp before starting a Progressive Web App (PWA) Service Worker (
0if the request is not intercepted by a Service Worker) - redirectStart — timestamp of the fetch which initiated a redirect
- redirectEnd — timestamp after receiving the last byte of the last redirect response
- fetchStart — timestamp before the resource fetch
- domainLookupStart — timestamp before a DNS lookup
- domainLookupEnd — timestamp after the DNS lookup
- connectStart — timestamp before the browser establishes a server connection
- connectEnd — timestamp after establishing a server connection
- secureConnectionStart — timestamp before the browser starts the SSL handshake process
- requestStart — timestamp before the browser requests the resource
- responseStart — timestamp when the browser receives the first byte of data
- responseEnd — timestamp after receiving the last byte or closing the connection
- duration — the difference between startTime and responseEnd
Both objects provide the following download size properties:
- transferSize — the resource size in bytes (octets), including the header and compressed body
- encodedBodySize — the resource’s payload body in bytes (octets) before decoding/uncompressing
- decodedBodySize — the resource’s payload body in bytes (octets) after decoding/uncompressing
Page [PerformanceNavigationTiming](https://developer.mozilla.org/docs/Web/API/PerformanceNavigationTiming) objects provide further metrics about loading and DOM events, although these are not supported in Safari:
- redirectCount — the number of redirects
- unloadEventStart — timestamp before the
unloadevent of the previous document (zero if no previous document) - unloadEventEnd — timestamp after the
unloadevent of the previous document (zero if no previous document) - domInteractive — timestamp before the browser sets the document readiness to interactive when HTML parsing and DOM construction is complete
- domContentLoadedEventStart — timestamp before document’s
DOMContentLoadedevent fires - domContentLoadedEventEnd — timestamp after document’s
DOMContentLoadedevent completes - domComplete — timestamp before the browser sets the document readiness to complete when DOM construction and
DOMContentLoadedevents have completed - loadEventStart — timestamp before the page
loadevent has fired - loadEventEnd — timestamp after the page
loadevent and all assets are available
Navigation timing
The Navigation Timing API collates timings for unloading the previous page, redirects, DNS lookups, page loading, file sizes, load events, and more. The information would be difficult to reliably determine in any other way.
Navigation timing is available to client-side JavaScript window and Web Worker functions. Pass a "navigation" type to the [performance.getEntriesByType()](https://developer.mozilla.org/docs/Web/API/Performance/getEntriesByType):
const pageTiming = performance.getEntriesByType('navigation');
or the page URL to [performance.getEntriesByName()](https://developer.mozilla.org/docs/Web/API/Performance/getEntriesByName):
const pageTiming = performance.getEntriesByName(window.location);
Either option returns an array with a single element containing a [PerformanceNavigationTiming](https://developer.mozilla.org/docs/Web/API/PerformanceNavigationTiming) object (see load timing properties). It contains read-only properties about the resource load times, e.g.
{
connectEnd: 139
connectStart: 103
decodedBodySize: 72325
domComplete: 771
domContentLoadedEventEnd: 634
domContentLoadedEventStart: 630
domInteractive: 421
domainLookupEnd: 103
domainLookupStart: 87
duration: 771
encodedBodySize: 13091
entryType: "navigation"
fetchStart: 0
initiatorType: "navigation"
loadEventEnd: 771
loadEventStart: 771
name: "https://domain.com/"
nextHopProtocol: "h2"
redirectCount: 0
redirectEnd: 0
redirectStart: 0
requestStart: 140
responseEnd: 154
responseStart: 154
secureConnectionStart: 115
serverTiming: Array []
startTime: 0
transferSize: 13735
type: "reload"
unloadEventEnd: 171
unloadEventStart: 169
workerStart: 0
}
You can use it to calculate useful page loading metrics from users, e.g.
if ('performance' in window) {
const
pageTiming = performance.getEntriesByName(window.location)[0],
pageDownload = pageTiming.duration,
pageDomReady = pageTiming.domContentLoadedEventStart,
pageFullyReady = pageTiming.loadEventEnd;
}
Resource timing
You can examine load timings for other resources such as images, stylesheets, scripts, Fetch, and XMLHttpRequest Ajax calls in a similar way to the page.
Resource timing is available to client-side JavaScript window and Web Worker functions. Pass a "resource" type to the [performance.getEntriesByType()](https://developer.mozilla.org/docs/Web/API/Performance/getEntriesByType) to return an array. Each element is a [PerformanceResourceTiming](https://developer.mozilla.org/docs/Web/API/PerformanceResourceTiming) object (see load timing properties) representing a resource loaded by the page (but not the page itself):
const resourceTiming = performance.getEntriesByType('resource');
example result:
[
{
name: "https://domain.com/script1.js",
entryType: "resource",
initiatorType: "script",
fetchStart: 102,
duration: 51
...etc...
},
{
name: "https://domain.com/style1.css",
entryType: "resource",
initiatorType: "link",
fetchStart: 323,
duration: 54
...etc...
},
{
name: "https://domain.com/service/",
entryType: "resource",
initiatorType: "xmlhttprequest",
fetchStart: 598,
duration: 30
...etc...
},
...etc...
]
You can also fetch a resource by passing its exact URL to [performance.getEntriesByName()](https://developer.mozilla.org/docs/Web/API/Performance/getEntriesByName):
const resourceTiming = performance.getEntriesByName('https://domain.com/style1.css');
This returns an array with a single element:
[
{
name: "https://domain.com/style1.css",
entryType: "resource",
initiatorType: "link",
fetchStart: 323,
duration: 54
...etc...
}
]
You could use this to report to calculate the load times and sizes of each JavaScript resource as well as the total:
if ('performance' in window) {
// total size of all JavaScript files
let scriptTotalSize = 0;
// array of script names, load times, and uncompressed file sizes
const script = performance.getEntriesByType('resource')
.filter( r => r.initiatorType === 'script')
.map( r => {
let size = r.decodedBodySize;
scriptTotalSize += size;
return {
name: r.name,
load: r.duration,
size
};
});
}
The Performance API records at least 150 resource metrics, but you can define a specific number with [performance.setResourceTimingBufferSize(N)](https://developer.mozilla.org/docs/Web/API/Performance/setResourceTimingBufferSize), e.g.
// record metrics for 300 page resources
performance.setResourceTimingBufferSize(300);
You can clear existing metrics with [performance.clearResourceTimings()](https://developer.mozilla.org/docs/Web/API/Performance/clearResourceTimings). This may be practical when you no longer require page resource information but want to record Ajax requests:
// clear timings
performance.clearResourceTimings();
// API Fetch request
const res = await Fetch('/service1/');
// one resource returned
const resourceTiming = performance.getEntriesByType('resource');
Paint timing
The Paint Timing API is available to client-side JavaScript window functions and records two rendering operations observed during page construction.
Pass a "paint" type to the [performance.getEntriesByType()](https://developer.mozilla.org/docs/Web/API/Performance/getEntriesByType) to return an array containing two PerformancePaintTiming objects:
const paintTiming = performance.getEntriesByType('paint');
The result:
[
{
"name": "first-paint",
"entryType": "paint",
"startTime": 242,
"duration": 0
},
{
"name": "first-contentful-paint",
"entryType": "paint",
"startTime": 243,
"duration": 0
}
]
where:
- first-paint: the browser has painted the first pixel on the page, and
- first-contentful-paint: the browser has painted the first item of DOM content, such as text or an image.
Note that "duration" will always be zero.
performance.now()
[performance.now()](https://developer.mozilla.org/docs/Web/API/Performance/now) returns a high-resolution timestamp in fractions of a millisecond since the beginning of the process's lifetime. The method is available in client-side JavaScript, Web Workers, Node.js, and Deno.
In client-side JavaScript, the performance.now() timer starts at zero when the process responsible for creating the document started. Web Worker, Node.js, and Deno timers start when the script process initially executes.
Note that Node.js scripts must load the Performance hooks ([perf_hooks](https://nodejs.org/dist/latest/docs/api/perf_hooks.html)) module to use the Performance API. In CommonJS:
const { performance } = require('perf_hooks');
or as an ES module:
import { performance } from 'perf_hooks';
You can use performance.now() to time scripts, e.g.
const doSomethingStart = performance.now();
doSomething();
const doSomethingElapsed = performance.now() - doSomethingStart;
A further non-standard [timeOrigin](https://developer.mozilla.org/docs/Web/API/Performance/timeOrigin) property returns the timestamp at which the current process began. This is measured in Unix time since 1 January 1970 and is available in Node.js and browser JavaScript (not IE or Safari):
User timing
performance.now() becomes cumbersome when taking more than a couple of timing measurements. The [performance.mark()](https://developer.mozilla.org/docs/Web/API/Performance/mark) method adds a named PerformanceMark object object with a timestamp to the performance buffer. It's available in client-side JavaScript, Web Workers, Node.js, and Deno:
// Node.js scripts require:
// CommonJS: const { performance } = require('perf_hooks');
// or ESM : import { performance } from 'perf_hooks';
performance.mark('script:start');
performance.mark('doSomething1:start');
doSomething1();
performance.mark('doSomething1:end');
performance.mark('doSomething2:start');
doSomething2();
performance.mark('doSomething2:end');
performance.mark('script:end');
Pass a "mark" type to the [performance.getEntriesByType()](https://developer.mozilla.org/docs/Web/API/Performance/getEntriesByType) to return an array of marks:
const userTiming = performance.getEntriesByType('mark');
The resulting array contains objects with name and startTime properties:
[
{
detail: null
duration: 0
entryType: "mark"
name: "script:start"
startTime: 100
},
{
detail: null
duration: 0
entryType: "mark"
name: "doSomething1:start"
startTime: 100
},
{
detail: null
duration: 0
entryType: "mark"
name: "doSomething1:end"
startTime: 123
},
...etc...
]
The [performance.measure()](https://developer.mozilla.org/docs/Web/API/Performance/measure) method calculates the elapsed time between two marks. It's passed the measure name, the start mark name (or a falsy value to use the page/script load time), and the end mark name (or a falsy value to use the current time), e.g.
performance.measure('doSomething1', 'doSomething1:start', 'doSomething1:end');
performance.measure('script', null, 'doSomething1:end');
This adds a PerformanceMeasure object to the performance buffer with a calculated duration. Pass a "measure" type to the [performance.getEntriesByType()](https://developer.mozilla.org/docs/Web/API/Performance/getEntriesByType) to return an array of measures:
const userTiming = performance.getEntriesByType('measure');
The resulting array:
[
{
detail: null
duration: 211
entryType: "measure"
name: "doSomething1"
startTime: 100
},
{
detail: null
duration: 551
entryType: "measure"
name: "script"
startTime: 100
}
]
You can also fetch mark and measure entries by name using [performance.getEntriesByName()](https://developer.mozilla.org/docs/Web/API/Performance/getEntriesByName):
performance.getEntriesByName('doSomething1');
Other useful methods include:
[performance.getEntries()](https://developer.mozilla.org/docs/Web/API/Performance/getEntries)— returns an array of all performance entries including marks, measures, navigation timing, resource timing, and paint timing[performance.clearMarks( [name] )](https://developer.mozilla.org/docs/Web/API/Performance/clearMarks)— clear a named mark, or omit the name to clear all marks[performance.clearMeasures( [name] )](https://developer.mozilla.org/docs/Web/API/Performance/clearMeasures)— clear a named measure, or omit the name to clear all measures
Frontend Monitoring
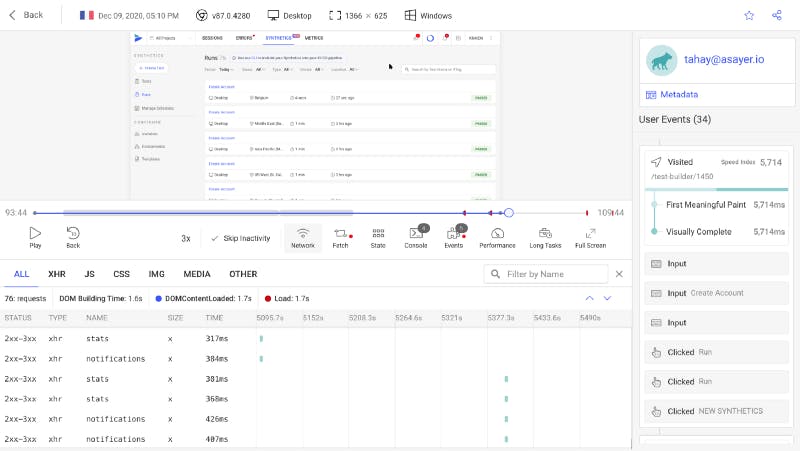
Asayer is a frontend monitoring tool that replays everything your users do and shows how your web app behaves for every issue. It lets you reproduce issues, aggregate JS errors and monitor your web app’s performance.
Happy debugging, for modern frontend teams — Start monitoring your web app for free.
PerformanceObserver
The PerformanceObserver interface can watch for changes to the performance buffer and run a function when specific objects appear. It’s most practically used for mark, measure, and resource loading events (navigation and paint timings will generally occur before a script has started).
First, define an observer function. This could log an event or post the data to a statistics endpoint:
function performanceObserver(list, observer) {
list.getEntries().forEach(entry => {
console.log('---');
console.log(`name : ${ entry.name }`);
console.log(`type : ${ entry.type }`);
console.log(`start : ${ entry.startTime }`);
console.log(`duration: ${ entry.duration }`);
});
}
The function has the following parameters:
Pass this function when creating a new PerformanceObserver object then run the [observe()](https://developer.mozilla.org/docs/Web/API/PerformanceObserver/observe) method with the entryTypes to observe:
Adding a new mark or measure will now run the performanceObserver() function and display details about that measurement.
Future performance options
Chrome-based browsers offer a non-standard [performance.memory](https://developer.mozilla.org/docs/Web/API/Performance/memory) property which returns a single MemoryInfo object:
where:
- jsHeapSizeLimit — the maximum size of the heap in bytes
- totalJSHeapSize — the total allocated heap size in bytes, and
- usedJSHeapSize — The currently active segment of JS heap in bytes.
The Frame timing API is not implemented in any browser, but will record the amount of browser work in one event loop iteration. This includes processing DOM events, CSS animations, rendering, scrolling, resizing, etc. The API should be able to report potential jerkiness when a frame takes longer than 16.7 milliseconds so updates drop below 60 frames per second.
Finally, the Self-Profiling API is an experimental feature under development in Chrome. Given a sample rate, the API will help locate slow or unnecessary code in a similar way to the DevTools performance report:
// define a new profiler with 10ms sample rate
const profile = await performance.profile({ sampleInterval: 10 });
// run code
doSomething();
// stop the profiler and capture a trace
const trace = await profile.stop();
Pinpoint performance problems
It’s easy to presume your application runs well when you’re developing on a new PC connected to a fast network. The performance API offers a way to prove — or disprove — performance issues by collecting real user metrics based on their devices, connections, and locations.
Originally published at blog.asayer.io on May 12, 2021.