12 Ways to Improve Your DevTools Console Logging

I am a freelance UK full-stack web developer with a few decades experience.
Few developers delve beyond the basics of browser DevTool debugging. The humble console.log() is often derided but we all use it. It's great for outputting values as code runs and usually helps pinpoint errors.
Yet there is a range of under-utilized, quicker, easier, and more useful options which can be used in client-side scripts, web workers, and service workers. Many are also supported in the Node.js and Deno runtime consoles.
1. Output variable names with ES6 destructuring assignment
Logging can become complex when more than one value is being monitored. It’s usually necessary to add further information, e.g.
const x = 42;
console.log('variableX:', variableX);
// or
console.log(`variableX: ${ variableX }`);
/*
output:
variableX: 42
*/
A quicker option is to use ES6 object destructuring assignment. This adds the variable to an object with a matching property name. In other words, just place { and } brackets around a variable to show its name and value:
console.log({ variableX });
/*
output:
{ variableX: 42 }
*/
2. Use appropriate log message types
console.log() is well-known:
console.log('no-frills log message');
but it’s not the only type. Messages can be classified as information (which is treated identically to console.log()):
console.info('this is an information message');
warnings:
console.warn('I warned you this could happen!');
errors:
console.error('I\'m sorry Dave, I\'m afraid I can\'t do that');
or less-important debugging messages:
console.debug('nothing to see here - please move along');
console.table() can output object values in a friendlier format:
const obj = {
propA: 1,
propB: 2,
propC: 3
};
console.table( obj );

The table can be sorted into property name or value order by clicking an associated heading.
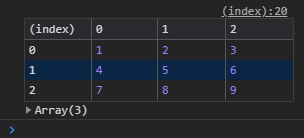
console.table() can also be used on single or multi-dimensional arrays:
const arr1 = [
[ 1, 2, 3 ],
[ 4, 5, 6 ],
[ 7, 8, 9 ]
];
console.table( arr1 );
or arrays of objects:
const arr2 = [
{ a: 1, b: 2, c: 3 },
{ a: 4, b: 5, c: 6 },
{ a: 7, b: 8, c: 9 }
];
console.table( arr2 );

Other options include:
console.dir( obj )displays an interactive list of properties in a JavaScript objectconsole.dirxml( element )displays an interactive tree of descendant elements from a specified HTML or XML nodeconsole.clear()clears the console of all previous messages.
3. Filter log messages
Browsers show log messages in appropriate colors but they can also be filtered to display specific types. Chrome’s side bar is opened by clicking the icon at the top left of the Console pane:

Note that console.debug() messages are only shown when the verbose option is viewed.
4. Use printf-type messages
All log types can use C-style [printf](https://en.wikipedia.org/wiki/Printf_format_string) message formats which defines a template with % indicators where a variable is substituted. For example:
console.log(
'The answer to %s is %d.',
'life, the universe and everything',
42
);
// The answer to life, the universe and everything is 42.
5. Log with style
Log messages can be styled using standard CSS passed as a string in a second parameter of any message type. A %c marker in the message indicates where the styling will be applied, e.g.
console.log(
'%cOK, things are really bad now!',
`
font-size: 2em;
padding: 0.5em 2em;
margin: 1em 0;
color: yellow;
background-color: red;
border-radius: 50%;
`
);
The result in the DevTools console:

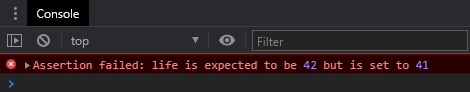
6. Use test-like assertions
The test-like console.assert() command can be used to output a message when a condition fails. Assertions can be defined using a condition followed by one or more objects to output when that condition fails, e.g.
console.assert(
life === 42,
'life is expected to be',
42,
'but is set to',
life
);
Alternatively, a message and substitution values can be used:
console.assert(
life === 42,
'life is expected to be %s but is set to %s',
42,
life
);
Both options show an assertion error when the condition fails:
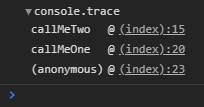
7. Run a stack trace
A log of all function calls that make up the current execution point can be output with console.trace():
function callMeTwo() {
console.trace();
return true;
}
function callMeOne() {
return callMeTwo();
}
const r = callMeOne();
The trace shows which line made each call and it can be collapsed or expanded in the Console pane:
8. Group logging messages
Logging messages can be separated into named groups using console.group( label ) at the start and console.groupEnd() at the end. Groups of messages can be nested and collapsed or expanded ( console.groupCollapsed( label ) shows the group in its collapsed state initially):
// start log group
console.group('iloop');
for (let i = 3; i > 0; i--) {
console.log(i);
// start collapsed log group
console.groupCollapsed('jloop');
for (let j = 97; j < 100; j++) {
console.log(j);
}
// end log group (jloop)
console.groupEnd();
}
// end log group (iloop)
console.groupEnd();

9. Use performance timers
The time( label ) command starts a timer. The elapsed time in milliseconds is then reported when an associated timeEnd( label ) command is reached. Timers can be used to assess the performance of an operation - it's easier and more accurate than managing your own Date() calculations, e.g.
// start timer
console.time('bigloop');
for (let i = 999999999; i > 0; i--);
// show elapsed time
console.timeEnd('bigloop');

Up to 10,000 timers can be added to a page and the console.timeLog( label ) command will report the elapsed time without stopping the timer.
A similar option is console.count( label ) which reports the number of times the command has been called. console.countReset( label ) resets the named counter back to zero.
10. Debug and monitor functions by name
The DevTools Sources panel (or Debugger in Firefox) allows you to open a file and set a breakpoint by clicking a line number. Chrome-based browsers also permit you to set a breakpoint by entering debug( functionName ) in the console, e.g.
debug( doSomething );
The function must be available in the global namespace and the browser will launch the debugger as soon as it is called. Debugging can be cancelled using undebug( functionName ) or by reloading the page.
The monitor( functionName ) and its associated unmonitor( functionName ) commands are used in a similar way. Rather than halting execution, they log each call to a function and show the passed arguments:
function doSomething called with arguments: "hello", 2
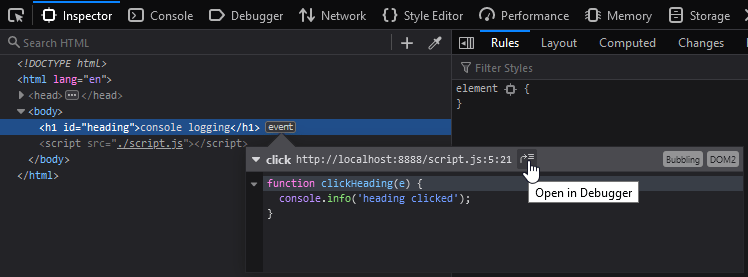
11. Find and fix event listeners
The Firefox DevTools Inspector panel shows an event icon next to any DOM element which has a handler attached. Click the icon to view the function name, then click the arrow icon on the left to expand the code. Alternatively, the Open in Debugger icon locates the handler in the Debugger pane so you can set breakpoints:
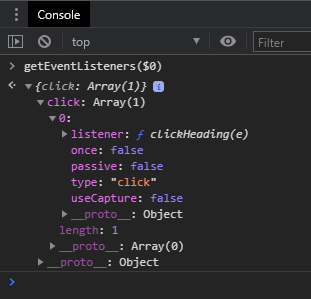
Chrome’s implementation is not as good, but you can view all event listeners by passing a DOM node to the getEventListeners() function. For example, getEventListeners( $0 ) shows the listeners applied to the DOM node currently highlighted in the Elements panel:
12. Copy properties to the clipboard
The console copy() command can copy any value to the clipboard. It can be a primitive value, array, object, or DOM node.
When passed a DOM node, copy() places the HTML of that element and all its children on the clipboard. It's identical to right-clicking a node and choosing Copy followed by Copy outerHTML.
The command copy( document.documentElement ) copies the whole HTML document. This can be pasted into a text editor and prettified to help read the markup.
Observability for Production Apps
Debugging your JavaScript apps in production may be challenging and time-consuming. Asayer is a frontend monitoring tool that replays everything your users do and shows how your app behaves and renders for every issue. It’s like having your browser’s inspector open while looking over your user’s shoulder.

Asayer helps to quickly get to the root cause by reproducing issues as if they happened in your own browser. It also monitors your frontend performance by capturing key metrics such as page load time, memory consumption and slow network requests.
Happy debugging, for modern frontend teams — Start monitoring your web app for free.
Delve into DevTools
Browser DevTools have evolved from rudimentary consoles to sophisticated development and debugging environments. console.log() will always be popular but the other options may offer a quicker and easier route to zero bugs!
Originally published at https://blog.asayer.io on March 12, 2021.